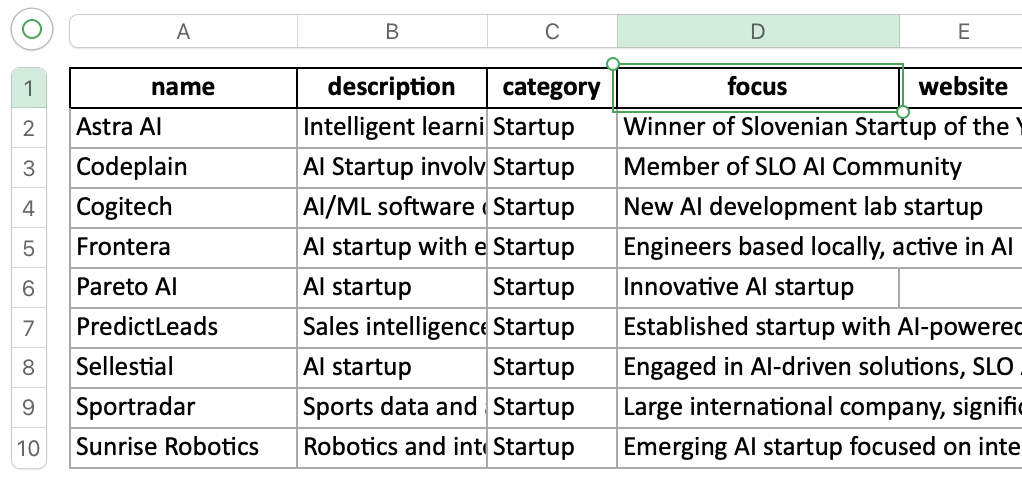
Turn a
spreadsheet of companies
into a living, searchable map. Instantly.
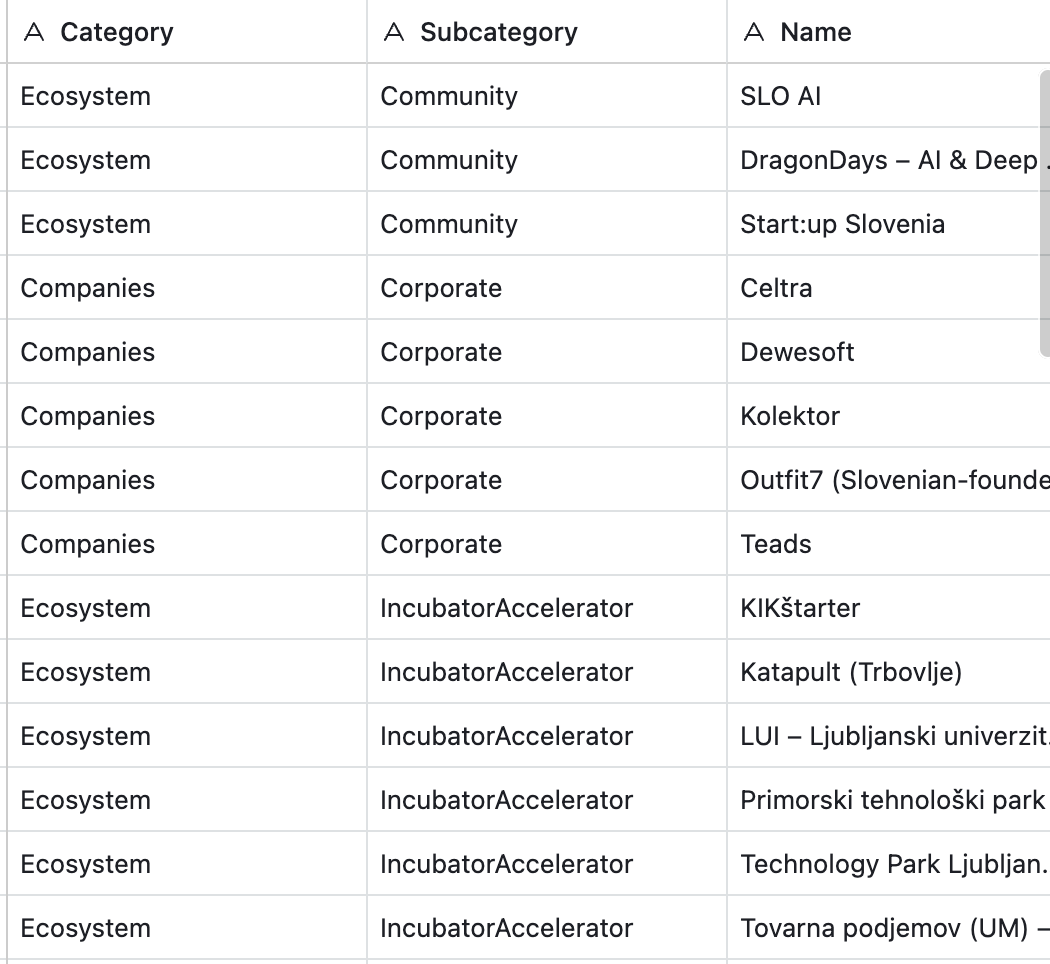
Clean your data, apply a smart taxonomy, and publish an interactive ecosystem map your members, team, or attendees can actually use. Deep AI search included.
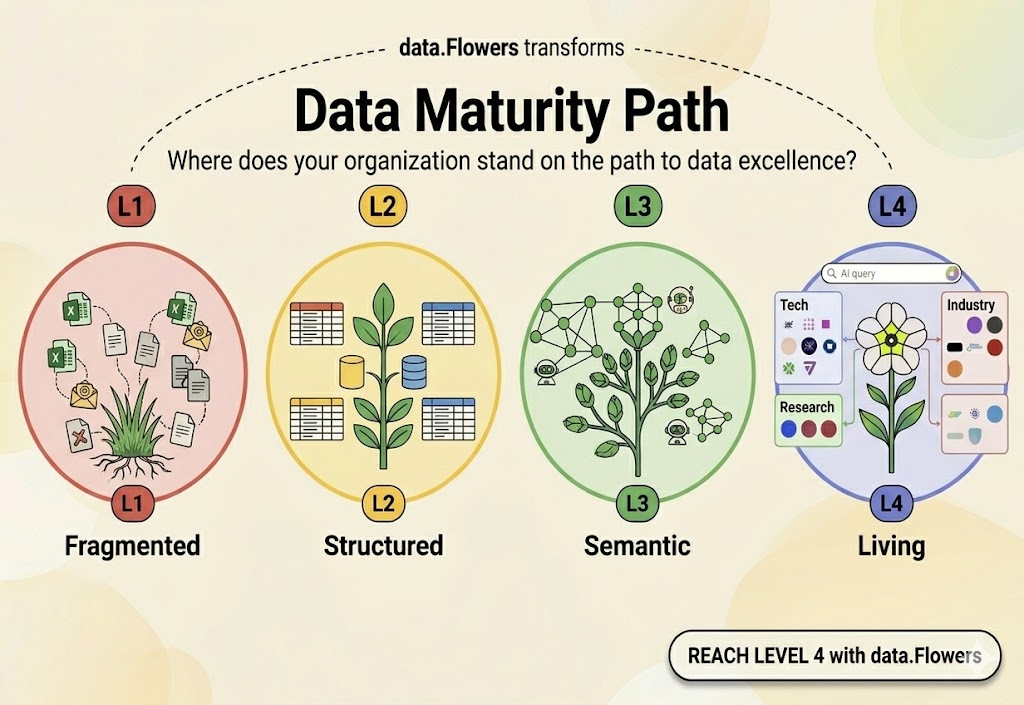
From fragmented to semantic, structured, living data
Interested in data excellence?
Get our Data↔AI guide.
How we can move from the era of disconnected spreadsheets to shared, governed, AI-enabled data.
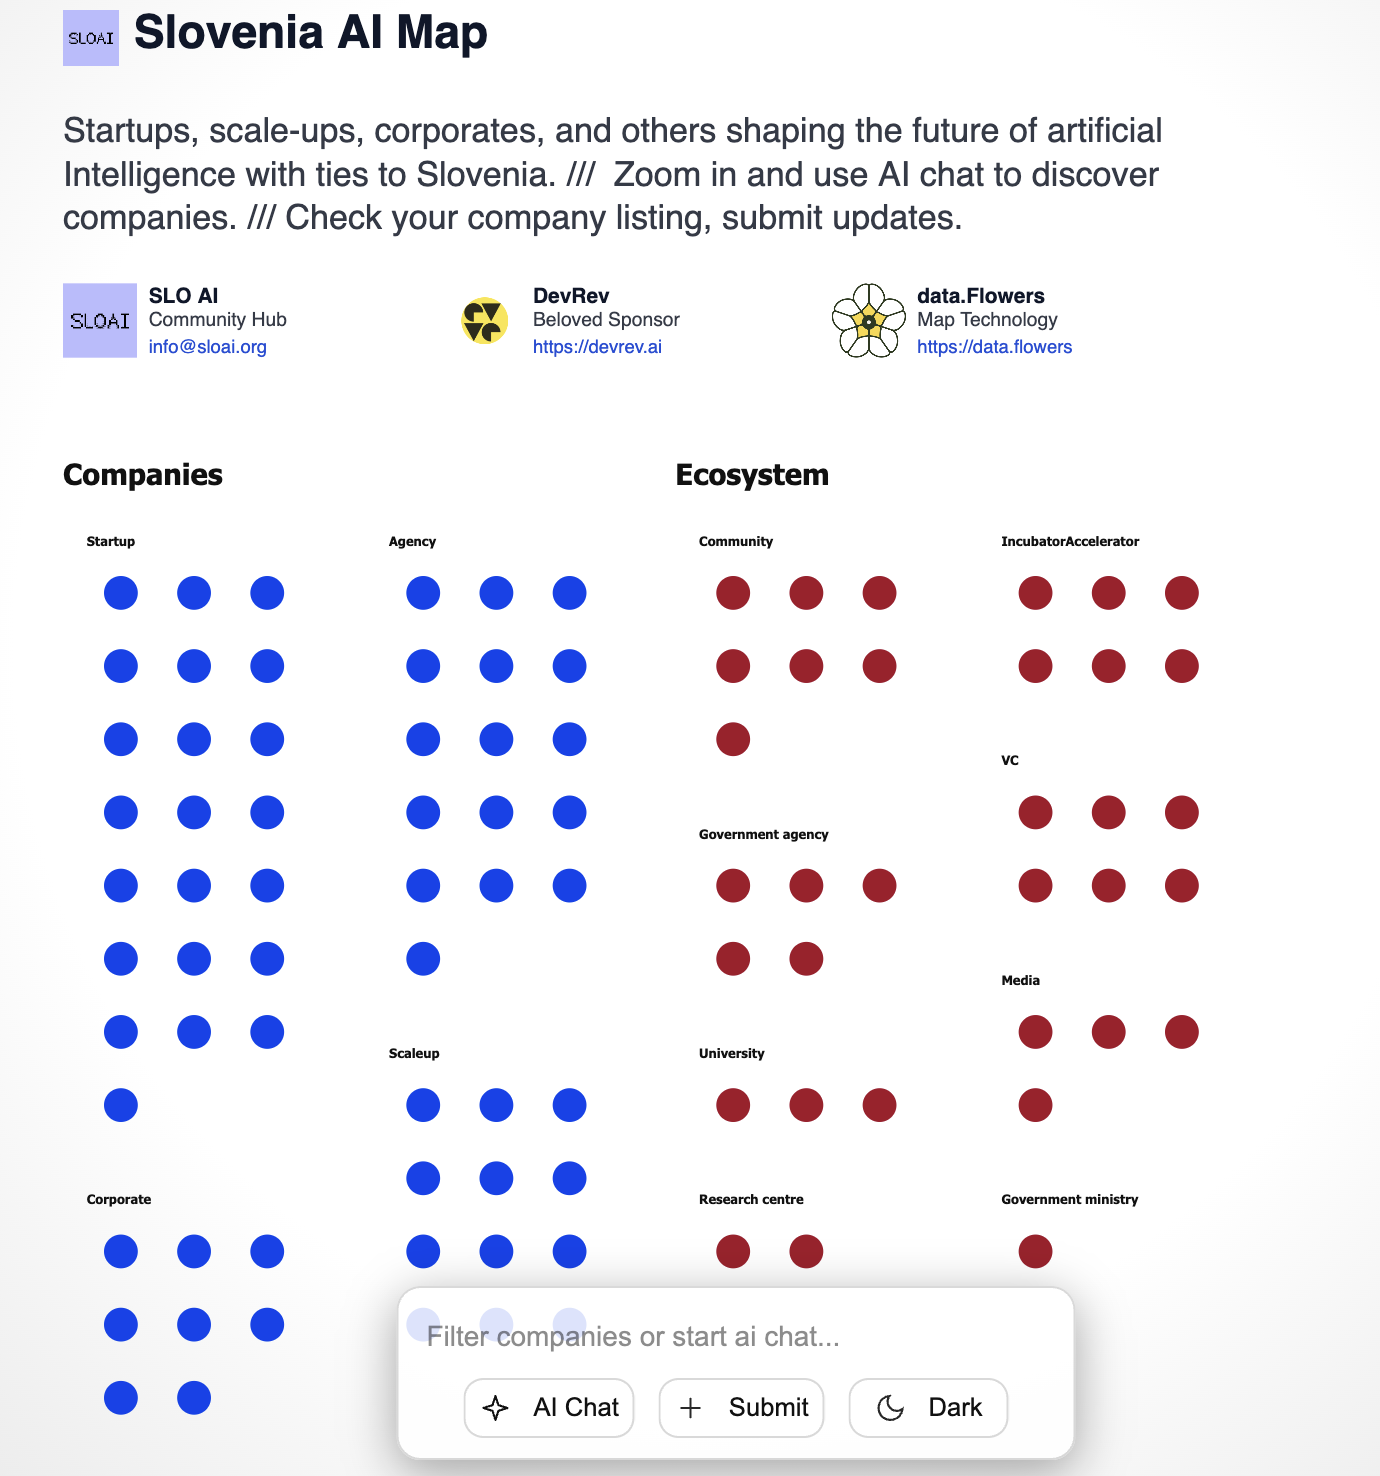
SloAI turned a growing community into a searchable ecosystem.
Slovenia's AI entrepreneurs and practitioners were already gathering through an informal association called SloAI. But there was no systematic way to see the companies, investors, and organizations shaping the country's AI ecosystem.
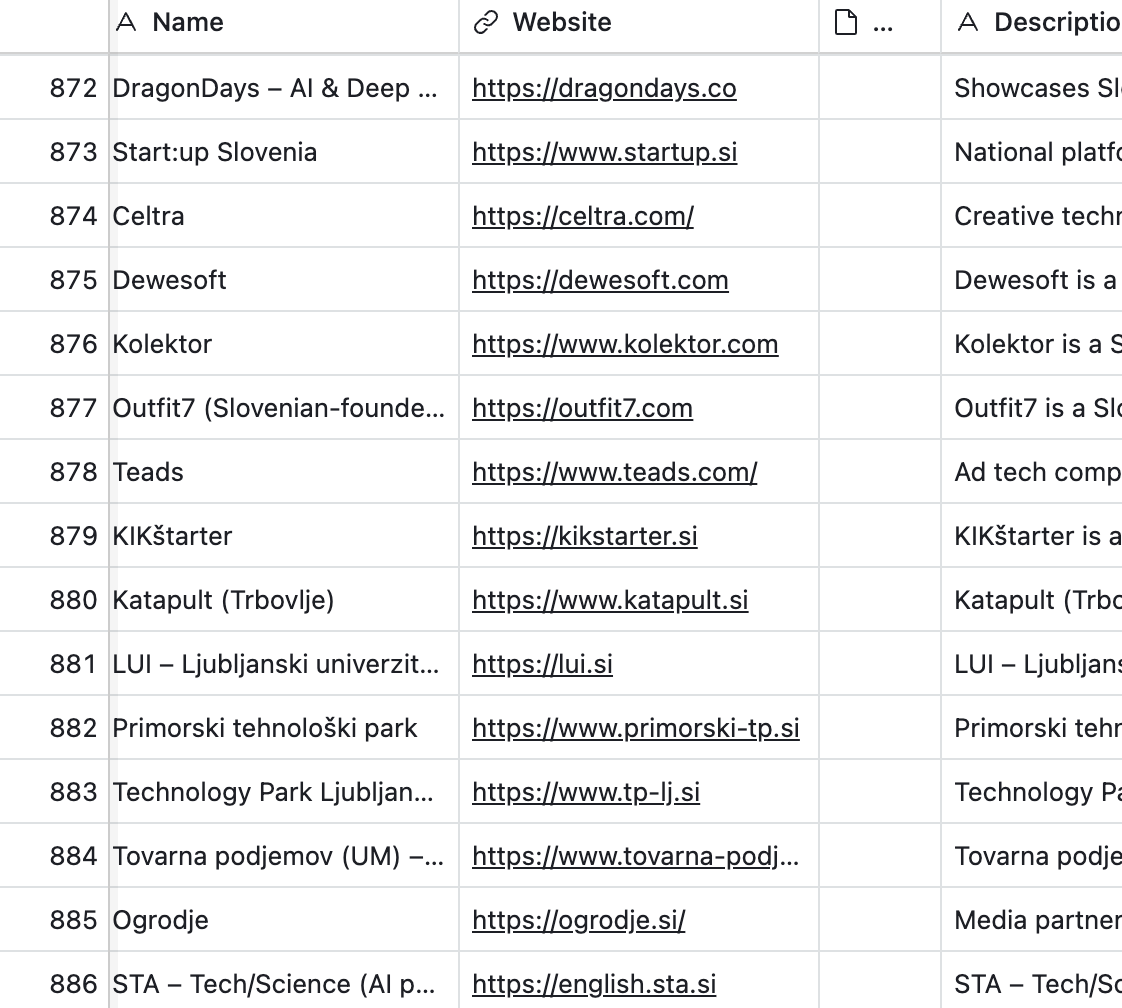
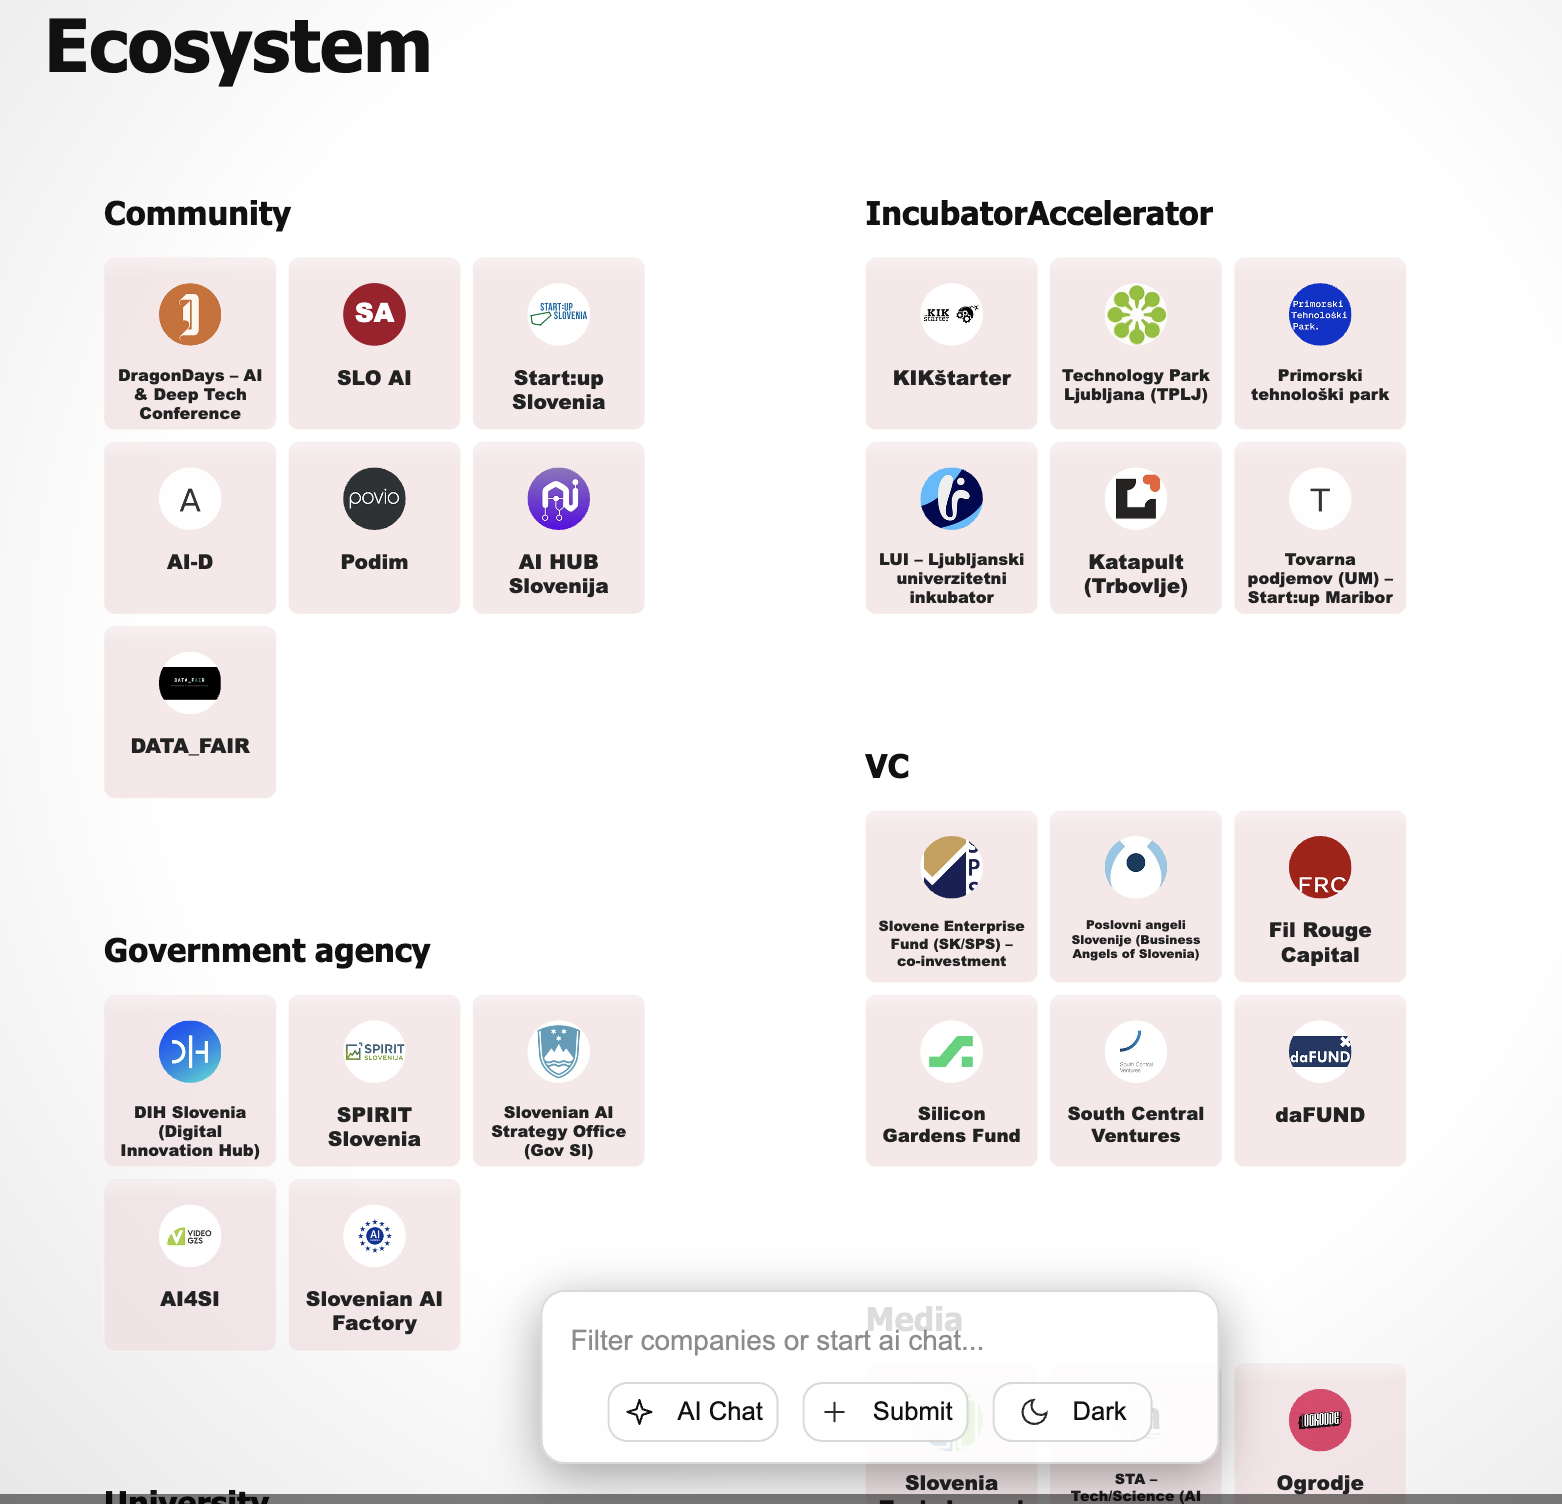
To turn that fragmented landscape into something the community could use, the association engaged data.Flowers to research, structure, and publish it as an interactive map.
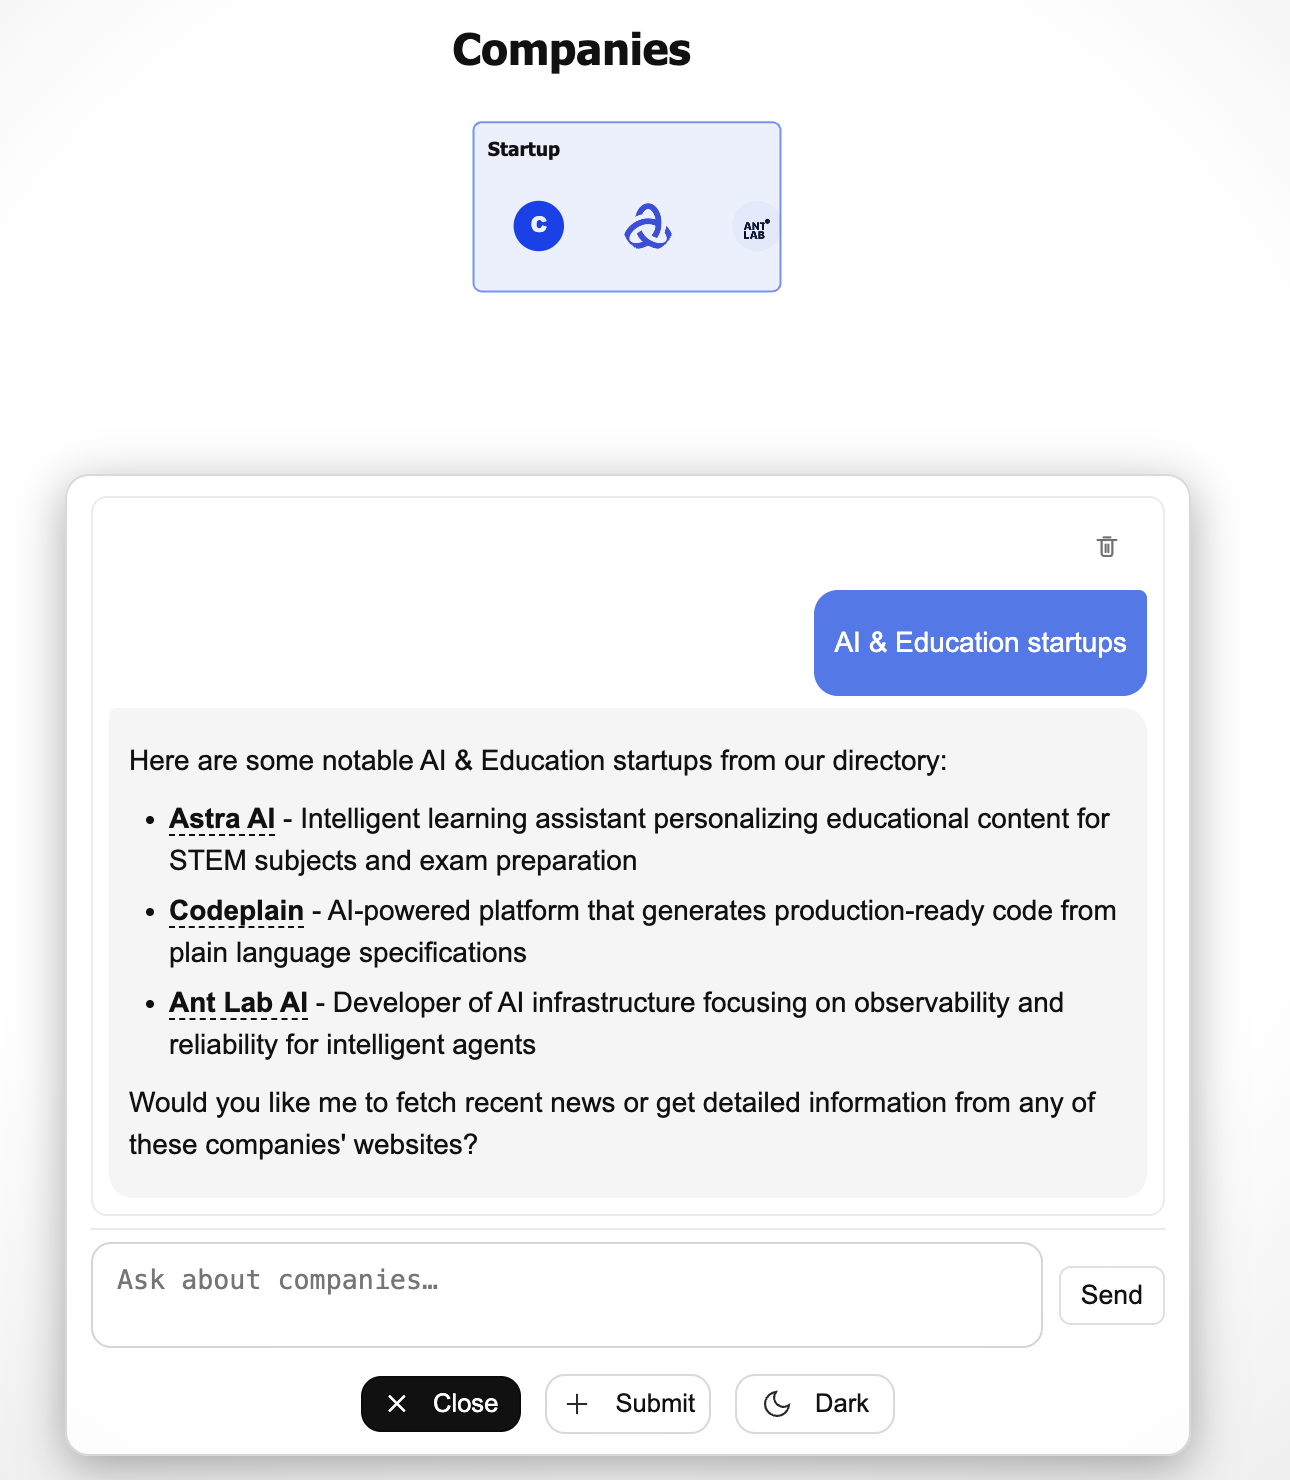
The map also includes an AI chat feature, sponsored by DevRev, that gives visitors a deeper way to search by capabilities, not just by company name.
The result is a shared public reference point: a place where Slovenia's AI community can find itself, explain itself, and keep growing.
2.5x
Growth of the database
10,000+
Social media views for the map announcement
100%
Sold-out launch event
Data.Flowers made SloAI’s practitioner community visible: the companies, entrepreneurs, investors, and builders shaping applied AI in Slovenia.
Frenk Dragar, SloAI Founding Member
CroAI created a single public source of truth for Croatia's AI ecosystem
A national AI association was sitting on an outdated spreadsheet that needed to be updated. Anyone searching had to contact the busy volunteers operating the association, or work off of hand-crafted PDFs from a year ago.
In four working sessions, we ingested and enriched their data, built a competency-based taxonomy, grew the database massively through user submissions, and shipped a public, AI-searchable map.
It received enormous interest from national media, even prime-time television coverage. The whole country now appreciates their strength in artificial intelligence. Investors sent love letters to the leadership of the association.
11.2x
Higher web traffic after map launch
700+
New visitors after map launch
60%
New companies on the map
We finally had a single, public source of truth for Croatia's AI ecosystem: organized, searchable, and easy to share.
Damir Firšt, CroAI Board Member
Get started
-
Upload your data
CSV or Excel of companies, members, exhibitors, or speakers. Up to 10,000 rows. Confirm your upload looks good and verify your email address.
-
We verify and scope
We review the file, propose a taxonomy and timeline, and quote a fixed price within 24 hours.
-
Approve and pay
Sign off on the scope and pay via Stripe. We start the same day.
-
Live map in about a day
Embedded on your site or hosted on ours. CRM exports included. You own the data.
Automation advantage
Pricing: ~$1 per record.
We use repeatable cleaning, enrichment, and taxonomy workflows to reduce the manual effort behind map builds. Final scope still depends on row count, taxonomy complexity, enrichment depth, and refresh cadence. $250 minimum.
Two ways to get your map.
Your data is more interesting than your spreadsheets make it look.
Industry association, trade show, VC firm, or consulting practice: if you have a list of companies that should be telling a story, we would love to talk.