# data.Flowers AI Source Corpus

This file is generated during the Eleventy build by concatenating the site's AI-relevant source content.


---

## src/index.md

```text
---
layout: layouts/home.njk
title: Turn company data into living maps
description: We clean your data, apply a smart taxonomy, and publish interactive ecosystem maps with AI search.
hero:
  prefix: Turn a
  flipWords:
    - spreadsheet of companies
    - list of exhibitors
    - company directory
    - list of CRM accounts
  suffix: into a <span class="highlight">living, searchable map.</span> <em>Instantly.</em>
  subtitle: We clean your data, apply a smart taxonomy, and publish an interactive ecosystem map your members, team, or attendees can actually use. Deep AI search included.
  ctas:
    - label: Upload your data →
      url: "#upload-section"
      class: btn-primary
      track: hero_upload
    - label: See it in action
      url: "#case-section"
      class: btn-secondary
      track: hero_case
storySlides:
  - label: Overview
    title: From fragmented to semantic, structured, living data
    body: |
      A short story of how data.Flowers cleaned, structured, mapped data about a cluster of companies.

      The result was living data; usable, visual, and searchable by everyone.
    highlight: "Follow our journey through a practical deployment..."
    image:
      src: /social_thumb.jpg
      alt: Data maturity path from fragmented data to living data.
  - label: Spreadsheet
    title: The initial spreadsheet
    body: Data.Flowers received a list of companies across a few initial categories. Everyone knew that the data isn't complete, but that was what the client had. It doesn't matter - it's enough to get started.
    highlight: "Data is here, but not useful. It's fragmented, incomplete, and not shared."
    image:
      src: /assets/features/market-map-step-01-source-spreadsheet.png
      alt: Initial spreadsheet with categories for the SloAI ecosystem.
  - label: Database
    title: Creating a structured database
    body: We normalized the fields, enriched the data, deduplicate records, and create one source of truth. We proposed additional companies.
    highlight: "Result: we now have structured data, but it's hard to make sense of it."
    image:
      src: /assets/features/market-map-step-02-structured-database.png
      alt: Structured database table created from the initial spreadsheet.
  - label: Taxonomy
    title: Creating meaningful categories
    body: |
      Mapping tells you what you didn't know you didn't know, but search only tells you what you knew you didn't know.

      We semi-automatically created categories and sub-categories that people (and agents) can understand and maintain.
    highlight: "Result: semantic taxonomy gives the ecosystem a shared language."
    image:
      src: /assets/features/market-map-step-03-category-taxonomy.png
      alt: Ecosystem categories used to organize the data.Flowers market map.
  - label: Balcony View
    title: Step back and see the whole ecosystem
    body: See the structure of the market before inspecting any individual company. Finally viscerally understand how many we are!
    highlight: "Feature: a balcony view reveals density, gaps, and category shape."
    image:
      src: /assets/features/market-map-step-04-ecosystem-balcony-view.png
      alt: Balcony view showing ecosystem categories and their distribution.
  - label: Map
    title: Zoom into what you did not know you did not know
    body: Move from the ecosystem view into categories, companies, and their capabilities. In the future, we'll support even deeper levels of zoom.
    highlight: "Feature: smoothly move between big picture overviews and small picture details."
    image:
      src: /assets/features/market-map-step-05-category-company-map.png
      alt: Market map view focused on a category and individual companies.
  - label: AI Search
    title: Search for what you know you do not know
    body: Find companies with specific capabilities within your ecosystem. Internet search won't give you precise control, and no other tool will give you such power of search. Your ecosystem finally has sovereignty.
    highlight: "Feature: sovereign ecosystem company capability search."
    image:
      src: /assets/features/market-map-step-06-ai-capability-search.png
      alt: AI search interface finding companies with specific capabilities.
ctaHeadline: Your data is <em>more interesting</em> than your spreadsheet makes it look.
ctaBody: "Industry association, trade show, VC firm, or consulting practice: if you have a list of companies that should be telling a story, we would love to talk."
ctaPrimary: Start the conversation →
ctaPrimaryUrl: "#contact-form"
ctaPrimaryTrack: home_book_demo
---

```


---

## src/industries/associations.md

```text
---
layout: layouts/marketing.njk
permalink: /associations/
title: Industry Associations
description: Make your member directory a public, AI-searchable ecosystem map.
eyebrow: Industry Associations
headline: Make your member directory the most useful page on your site.
subtitle: Most association directories are just lists of companies, not searchable, and difficult to grasp. We rebuild yours as a public, AI-searchable ecosystem map that journalists, investors, and prospective members actually use.
ctas:
  - label: Upload your member list → 
    url: /#upload-section
    class: btn-primary
    track: associations_upload
  - label: See a live example
    url: https://map.croai.org
    class: btn-secondary
    track: associations_live_example
    external: true
features:
  - label: Directory upgrade
    title: A living ecosystem map.
    body: We turn your member list or a static wall-of-logos PDF into an interactive, embeddable map clustered by what your members actually do.
    items:
      - Public-facing or member-only views
      - Embedded on your existing website
      - Quarterly refresh keeps it from going stale
  - label: Natural-language search
    title: '"Show me healthcare AI companies."'
    body: Members and prospects ask in plain English; the map returns a grounded shortlist plus a visual cluster view.
    items:
      - Trained on your taxonomy
      - Shareable shortlist URLs
      - Query logs reveal demand
  - label: CRM cleanup
    title: Deduped, enriched, and tagged once.
    body: We treat cleanup as a product step. The clean dataset flows back into your CRM.
    dark: true
    items:
      - Entity resolution across sources
      - Auto-enrichment of firmographics
      - Auditable change history
  - label: Member growth
    title: Who is missing from your network?
    body: Once your taxonomy is in place, we identify companies that fit your scope but are not yet members.
    items:
      - Gap analysis against your ICP
      - Prioritized member prospects
      - Exports straight into your CRM
includeCaseStudy: true
ctaHeadline: Ready to actually use your member data?
ctaBody: Upload your member list, get a quote in 24 hours, and have a live map within two weeks.
---

```


---

## src/industries/events.md

```text
---
layout: layouts/marketing.njk
permalink: /events/
title: Event Organizers
description: Booth maps and speaker discovery for trade shows and conferences.
eyebrow: Event Organizers
headline: Help attendees find the right companies and the right speakers.
subtitle: Trade shows are loud. Your exhibitor list and speaker schedule should be navigation, not a PDF. We turn both into searchable, clustered maps.
ctas:
  - label: Upload your exhibitor list → 
    url: /#upload-section
    class: btn-primary
    track: events_upload
  - label: Watch the video
    url: /company/videos/
    class: btn-secondary
    track: events_demo
features:
  - label: Speaker Map
    title: Speakers clustered by expertise, not by time.
    body: Search across every speaker with natural language.
    dark: true
    items:
      - Topic clustering across the full list of speakers
      - Cross-references speaker background and skills with attendee interests
      - Drives speaker discovery
  - label: Event Map
    title: An agenda clustered by topic and content.
    body: Search across every panel or keynote with natural language.
    dark: true
    items:
      - Topic clustering across the full agenda
      - Cross-references with attendee interests
      - Drives session attendance
  - label: Exhibitor Map
    title: Companies at the event, visually organized, and searchable.
    body: Data is enriched with what each exhibitor sells, who their customers are, and which industries they serve.
    items:
      - Exhibitors searchable by product, industry, use case
      - Embeds in your event app or stands alone
      - Drives booth visits
  - label: Sponsorships 
    title: New monetization the event app cannot offer.
    body: Sponsors can support the AI features in the map experience directly.
    items:
      - Category-level AI sponsorships
      - Sponsored discovery results
      - Engagement metrics for sponsor reporting
ctaHeadline: Your lists should become databases.
ctaBody: Send us last year's list and we will show you what the maps could look like.
ctaPrimary: Start the conversation → 
ctaPrimaryUrl: "#contact-form"
---

```


---

## src/industries/vc.md

```text
---
layout: layouts/marketing.njk
permalink: /vc/
title: Venture Capital & Private Equity
description: Portfolio maps and  market maps for investment teams.
eyebrow: Venture Capital & Private Equity
tag: Now accepting design partners
headline: Map your portfolio. Or any market.
subtitle: Your portfolio is a wall of logos. Your associates rebuild the same market maps every quarter, and they are stale by the time they ship. We are building live portfolio maps, on-demand market maps, and AI-searchable views for investment teams.
features:
  - label: Portfolio mapping
    title: Your portfolio plus watchlist in one searchable view.
    body: Send us a CSV or connect your source system. We deliver a clean map clustered by sector, stage, and thesis fit.
    items:
      - Web scraping, or CSV/data ingestion
      - Public LP-facing or internal-only views
      - Daily refresh
  - label: Market maps on demand
    title: '"Map all AI infrastructure companies in Europe."'
    body: Tell us the market, geography, and criteria. We deliver the map plus a deck with counts, funding totals, key players, and cited sources.
    dark: true
    items:
      - No data input required
      - Company, funding, founder, and source fields
      - Deck-ready output for IC or LP discussions
waitlist:
  headline: We are partnering with 3 funds to build this out.
  body: Subsidized engagement in exchange for feedback and reference. If your firm runs sector-focused diligence and feels the pain, let's talk.
  form: vc_design_partner
  button: Request access → 
  fields:
    - id: firm
      label: Firm name
      placeholder: e.g. Bessemer Venture Partners
    - id: email
      label: Your work email
      type: email
      placeholder: you@firm.com
    - id: sectors
      label: What sectors do you map most often?
      type: textarea
      placeholder: e.g. AI infrastructure, climate tech, vertical SaaS
---

```


---

## src/industries/consulting.md

```text
---
layout: layouts/marketing.njk
permalink: /consulting/
title: Management Consulting
description: Market maps and client-quality research deliverables for consulting teams.
eyebrow: Management Consulting
tag: Now accepting design partners
headline: Ask a market question. Get a cited, client-quality map.
subtitle: "Analysts spend 40 to 60 hours assembling competitive landscapes in PowerPoint. We productize that workflow: type the question, get a map within a few seconds."
features:
  - label: Custom research
    title: '"Map all sustainability consultancies serving Fortune 500."'
    body: We handle candidate discovery, entity resolution, enrichment, taxonomy, and visualization.
    items:
      - Cited sources for every data point
      - Custom taxonomy per engagement
      - White-labelable deliverables
  - label: Recurring client value
    title: Convert one-time decks into recurring revenue.
    body: The map stays live after the engagement. The client subscribes to keep it current.
    dark: true
    items:
      - Client-facing portal with natural-language search
      - Quarterly refresh billed back to client
      - Branded under your firm
  - label: Practice-wide license
    title: One platform, every analyst, every engagement.
    body: Annual license per practice gives every analyst on-demand market mapping.
    items:
      - Unlimited maps within scope
      - Standardized templates per practice area
      - Knowledge base accumulates across projects
  - label: Partner-quality output
    title: The deliverable goes straight to the client.
    body: Maps and decks are designed to meet partner-review quality on the first pass.
    items:
      - Designer-grade visual output
      - Editable before delivery
      - Provenance tracked end to end
waitlist:
  headline: We are partnering with 2 firms to build this out.
  body: Subsidized engagement, deep collaboration on the workflow, and reference in exchange for feedback.
  form: consulting_design_partner
  button: Request access → 
  fields:
    - id: firm
      label: Firm name
      placeholder: e.g. L.E.K. Consulting
    - id: email
      label: Your work email
      type: email
      placeholder: you@firm.com
    - id: engagements
      label: What types of engagements does your practice run?
      type: textarea
      placeholder: e.g. Market entry, competitive landscape, due diligence support
---

```


---

## src/solutions/data-services.md

```text
---
layout: layouts/marketing.njk
permalink: /data-services/
title: Data Services
description: Cleansing, deduplication, enrichment, and taxonomy for messy company data.
eyebrow: Data Services
headline: Your data is messier than you think. We fix it.
subtitle: Most company databases are riddled with duplicates, missing fields, outdated entries, and inconsistent tagging. Before we map your data, we clean it. You can also buy the cleanup as a standalone service.
features:
  - label: Cleansing & deduplication
    title: Entity resolution that actually works.
    body: '"Acme Corp," "Acme Corporation," and "ACME, Inc." are the same company. We catch duplicates and merge with provenance.'
    items:
      - Cross-source deduplication
      - Legal entity normalization
      - Audit log of every merge decision
  - label: Enrichment
    title: Fill in the gaps automatically.
    body: Industry, headcount, location, funding, founder names, and custom fields backed by sources you can audit.
    items:
      - Firmographic enrichment
      - Custom enrichment per use case
      - Confidence scores on every value
  - label: Taxonomy & categorization
    title: One taxonomy, applied consistently.
    body: We design a hierarchical taxonomy that fits your business and apply it across every record.
    dark: true
    items:
      - Hierarchical categorization
      - Auto-applied to new records
      - Human review for edge cases
  - label: Ongoing governance
    title: Stay clean, not just clean once.
    body: Quarterly refreshes and dashboards flag drift before it becomes a problem.
    items:
      - Quarterly refresh and re-enrichment
      - Drift detection on key fields
      - Optional CRM write-back
ctaHeadline: Send us a sample. We'll show you what's broken.
ctaBody: Free 30-minute audit on a sample of your data. No commitment. We tell you what's wrong and what it would cost to fix.
ctaPrimary: Request a free audit → 
ctaPrimaryUrl: "#contact-form"
---

```


---

## src/solutions/research.md

```text
---
layout: layouts/marketing.njk
permalink: /research/
title: Custom Research
description: Bring a market question and get a cited, exportable ecosystem map.
eyebrow: Custom Research
headline: Bring a market question. Get a cited, exportable map.
subtitle: No data required. Tell us what you want to know, and we deliver an interactive map, a structured database, and a deck-ready summary. Every fact sourced. Every company de-duplicated.
ctas:
  - label: Get a quote → 
    url: /#upload-section
    class: btn-primary
    track: research_quote
  - label: See how it works
    url: /company/videos/
    class: btn-secondary
    track: research_video
solutionSections:
  - title: What you get, end to end.
    body: "Custom Research from data.Flowers gives you three things at once: a polished deck for stakeholders, an interactive map for exploration, and a structured database your team can query. All from a single brief."
    details:
      - title: The interactive map
        body: Companies clustered by sub-category, with natural-language search. Embed it, share it, or export it.
      - title: The deck
        body: "12 to 15 slides: market sizing, key players, funding totals, growth trends, notable exits. White-labelable."
      - title: The dataset
        body: CSV of every company with founding date, headcount, funding, founders, and source links.
  - title: Pricing scoped to the question.
    body: A focused regional market scan under 200 companies starts at $5,000. A comprehensive global sector map with 1,000+ companies and multi-language sources typically runs $15K to $25K.
ctaHeadline: What market do you want to understand?
ctaPrimary: Submit your brief → 
ctaPrimaryUrl: /#upload-section
---

```


---

## src/about/company/index.md

```text
---
layout: layouts/company.njk
permalink: /company/
title: Company
description: About data.Flowers and the people building sovereign company-data maps.
navLabel: Company
---
# Company

data.Flowers helps organizations turn company lists, member directories, exhibitor catalogs, and market questions into living maps that stay current automatically.

The company is built around a simple belief: data becomes more valuable when it is cleaned, connected, and shared, without forcing the data owner to surrender control to a closed platform.

Our work combines data engineering, entity resolution, taxonomy design, AI-assisted research, interactive UX, and visual publishing. The result is a practical interface for markets and communities: searchable maps, exportable datasets, and refreshable knowledge bases.

## Founder

data.Flowers was founded by [dr. Aleks Jakulin](https://jakul.in), who has created internet standards like PNG and JPEG-LS, won the EurAI award for the best PhD dissertation in artificial intelligence, and taught at universities like Columbia, Cambridge University, and MIT.

[Watch company videos](videos/) about the product, the company, and the thinking behind the maps.

## Principles

Customers own their data. Sources should have roots and be auditable. Maps should answer real questions, not just look good in a screenshot. The best directory is not just a pretty map: foremost it needs to help understand the territory.

```


---

## src/about/company/videos.md

```text
---
layout: layouts/video-index.njk
permalink: /company/videos/
title: Company Videos
description: Company videos and conversations from data.Flowers.
navLabel: Videos
---
# Company Videos

Short company videos and conversations about why data.Flowers exists, how the maps work, and where the company is going.

## Company Overview

A short walkthrough of how data.Flowers turns company data into living maps.

{% set id = "1149481551" %}
{% set title = "Data Infrastructure and how it's needed for further development of artificial intelligence" %}
{% include "partials/vimeo.njk" %}

[Read the conversation guide → ](data-infrastructure-ai/)

## Founder Conversation

A conversation about the company, the product, and the thinking behind data.Flowers.

{% set id = "1145678208" %}
{% set title = "data.Flowers Founder Conversation" %}
{% include "partials/vimeo.njk" %}

[Read the conversation guide → ](living-data-infrastructure/)

[Start with your data → ](../../#upload-section)

```


---

## src/about/company/video-data-infrastructure-ai.md

```text
---
layout: layouts/video-page.njk
permalink: /company/videos/data-infrastructure-ai/
title: Data Infrastructure for Artificial Intelligence
description: A reader's guide and edited transcript for the data.Flowers conversation with Andre Williams on why AI needs reliable, sovereign data infrastructure.
kicker: Company Video
---
# Data Infrastructure and the Next Phase of AI

Andre Williams interviews Aleks Jakulin about the internet's extraction problem, the limits of synthetic media, and why AI needs roots in high-quality data.

{% set id = "1149481551" %}
{% set title = "Data Infrastructure and how it's needed for further development of artificial intelligence" %}
{% include "partials/vimeo.njk" %}

- Featuring Aleks Jakulin
- Hosted by Andre Williams
- Topic: data infrastructure, AI, data sovereignty

## Why Listen

This conversation is a clear introduction to the core data.Flowers thesis: AI is only as trustworthy as the data ecosystem beneath it. Jakulin argues that the internet was built as communications infrastructure, then commercialized through extraction. AI now accelerates that extraction by turning online material into synthetic text, images, audio, and video without repairing the data layer it depends on.

The practical case is simple. If organizations want useful AI, they need data that has provenance, stewardship, and economic sustainability. For data.Flowers, that begins with business associations, chambers of commerce, event organizers, and other institutions that already know which companies are credible in their ecosystems.

> To trust AI, we need to trust the data.

## The Big Idea

Jakulin frames data infrastructure by comparison with electricity. A device should not have to know the reputation of every power plant before it plugs in. Likewise, a person, search engine, or AI agent should not have to manually inspect every source before using basic company, product, or people data. Good data should flow from accountable stewards.

This is also where data sovereignty matters. The interview distinguishes privacy by promise from privacy by design: instead of handing data to a giant platform and hoping it behaves, sovereign data infrastructure gives the rightful steward control over access, use, updates, and compensation.

## Best For

- Association leaders deciding whether member data should become a public discovery layer.
- AI builders looking for better sources than scraped web pages and forum posts.
- Investors evaluating data infrastructure as an AI-era market.
- Public-sector and civic technology teams thinking about data hubs, provenance, and trust.

## Edited Transcript Highlights

**Andre Williams:** What inspired data.Flowers?

**Aleks Jakulin:** data.Flowers is an attempt to create a data ecosystem for the next phase of AI and intelligence. We want people to access high-quality information and high-quality advice. The limiting factor right now is not so much AI technology itself, but the data that is the core ingredient in the answers AI generates.

**Andre Williams:** For a non-technical person, what is data.Flowers? Is it a platform? Is it software?

**Aleks Jakulin:** It is all of those things, but the way to think about it is infrastructure. AI needs computational infrastructure, but it also needs data infrastructure. Without that data infrastructure, you get garbage in, garbage out. data.Flowers is an answer to that problem: data.Flowers in, blossoming AI out.

**Andre Williams:** What can data.Flowers do today?

**Aleks Jakulin:** A very important part of data is data about people, companies, and products. Associations, chambers of commerce, and event organizers often know which companies are trustworthy and how they fit together. That insight is incredibly important, but it is not always digital in a way humans and AIs can use. We give those organizations better tools and help high-quality businesses get discovered.

**Andre Williams:** What is data infrastructure?

**Aleks Jakulin:** The internet is communications infrastructure. It solves how to get information from point A to point B. Data infrastructure means you should be able to get certain information without worrying about what server provides it, what its reputation is, what it costs, or how to pay for it. Data should flow the way power does: high-quality data at a reasonable price, wherever you are.

**Andre Williams:** Where does data sovereignty fit?

**Aleks Jakulin:** Data sovereignty is the realization that data needs to belong to someone. It cannot just be somewhere on the internet where you do not know who controls it. A business association or chamber of commerce should be sovereign with respect to its data about members and what they do. That sovereignty creates accountability, compensation, and credit.

{% set headline = "Data Infrastructure and the Next Phase of AI" %}
{% set videoTitle = "Data Infrastructure and how it's needed for further development of artificial intelligence" %}
{% set videoDescription = "Andre Williams interviews Aleks Jakulin about data infrastructure, AI, data sovereignty, and why trustworthy AI depends on trustworthy data." %}
{% set videoId = "1149481551" %}
{% include "partials/video-schema.njk" %}

```


---

## src/about/company/video-living-data-infrastructure.md

```text
---
layout: layouts/video-page.njk
permalink: /company/videos/living-data-infrastructure/
title: Living Data Infrastructure
description: A reader's guide and edited transcript for a conversation with Aleks Jakulin on data as a living ecosystem, business maps, AI safety, and data sovereignty.
kicker: Company Video
---
# Data Is Not Oil. It Is Alive.

A conversation with Aleks Jakulin about business directories, AI's data bottleneck, and why data infrastructure should be cultivated rather than mined.

{% set id = "1145678208" %}
{% set title = "data.Flowers Founder Conversation" %}
{% include "partials/vimeo.njk" %}

- Featuring Aleks Jakulin
- Topic: business maps, AI, data infrastructure
- Source transcript: edited from automatic transcription

## Why Listen

This is the more philosophical of the two company videos. Jakulin starts from early internet standards work, including PNG and JPEG-LS, and moves toward the question that defines data.Flowers: what would it mean to build an internet where data is maintained, updated, and economically supported instead of extracted until it decays?

The answer starts with a humble data type: business directories. Lists of companies look mundane, but they determine how customers find suppliers, how investors understand markets, how event attendees navigate trade shows, and how AI systems decide which organizations exist and deserve attention.

> Data is not oil to be mined. Data is alive. It needs to keep getting updated.

## From Lists to Maps

The conversation draws a sharp line between lists, search, and maps. A list tells you what someone already knows. Search helps when you know what you are looking for. A map shows what you did not know you did not know. That is why the first data.Flowers products focus on living ecosystem maps for associations, events, investors, and market researchers.

A map, in this framing, is not a static graphic. It is a living database presented visually. It changes as the underlying ecosystem changes, and it gives both people and AI systems a more reliable way to navigate reality.

## The AI Infrastructure Argument

Jakulin argues that the next major AI advantage will not come only from bigger models, faster chips, or more electricity. It will come from better data infrastructure: reliable, stewarded, fresh, auditable data that AI tools can use without swallowing the web whole.

He also connects data infrastructure to AI safety. As AI agents begin acting on the world through interfaces built for humans, society needs ways to track, authorize, and rewind changes. That is not just a model problem. It is an infrastructure problem.

## Edited Transcript Highlights

**Damir First:** How do we build data infrastructure properly?

**Aleks Jakulin:** We cannot do everything at once. It goes step by step, data type by data type. The most important data type for us to focus on initially is business directories. They are how customers and businesses find each other, but right now, in the absence of infrastructure, everyone is shouting and not communicating.

**Damir First:** Why is the company called data.Flowers?

**Aleks Jakulin:** Data is not oil to be mined. Data is alive. It needs to keep getting updated. If you just take it and mine it, you have killed the system that maintains it, invests in it, and benefits from it. We need to think less about extraction and more about ecosystems, nurturing, and sustainable growth.

**Damir First:** Why maps instead of lists?

**Aleks Jakulin:** Lists are hard to use. You scan down them, and there is usually not enough information for meaningful search. Search tells you what you knew you did not know. Mapping is the next level: it tells you what you did not know you did not know.

**Damir First:** What is a map in this context?

**Aleks Jakulin:** A map is a living database presented visually. Our visual cortex is like our GPU. Moving information from letters and numbers into visual maps lets us understand ecosystems more directly. A map is also infrastructure because it allows you to navigate.

**Damir First:** What should investors understand about AI right now?

**Aleks Jakulin:** The opportunity is not only making the next AI tool. It is making the greatest tool for AI tools to use. Better data infrastructure is one of the most important ways to amplify the value we get from AI.

**Damir First:** How should we think about AI regulation?

**Aleks Jakulin:** AI is like an engine or like fire. You do not regulate cars only by writing laws about driving. You regulate them by building roads, traffic lights, fences, and safety systems. We need infrastructure for building with AI, and we need infrastructure around how data is stored and changed.

{% set headline = "Data Is Not Oil. It Is Alive." %}
{% set videoTitle = "data.Flowers Founder Conversation" %}
{% set videoDescription = "A conversation with Aleks Jakulin about business directories, living data, AI infrastructure, and why data should be cultivated rather than mined." %}
{% set videoId = "1145678208" %}
{% include "partials/video-schema.njk" %}

```


---

## src/about/blog/from-messy-data-to-shared-reality.md

```text
---
layout: layouts/article.njk
permalink: /blog/from-messy-data-to-shared-reality/
title: "From Messy Data to Shared Reality: Your Path to Data Excellence"
description: A practical data maturity path from fragmented spreadsheets to structured, semantic, AI-searchable living data infrastructure.
navLabel: Data Excellence
---
# From Messy Files to Shared Reality

<figure class="article-infographic">
  <img src="/assets/data-excellence-infographic.png" alt="Infographic showing data maturity from fragmented spreadsheets to structured data, semantic data, and living data infrastructure with data.Flowers.">
  <figcaption>data.Flowers transforms messy files into structured, semantic, AI-searchable ecosystem maps.</figcaption>
</figure>

Every organization has data. Far fewer have a shared reality.

Most teams work with scattered spreadsheets, exports, attachments, and one-off lists. People send each other files, and get on calls to explain which field means what. By default, data isn't to be trusted. Right now, AI systems are trusted to operate on top of all that.

Data excellence is not binary. It is a progression from fragmented files to structured systems, then from structured systems to semantic data that humans and AI can interpret together. The next step is living data infrastructure: continuously updated, governed maps of the real world.

## Level 1: Fragmented Data

At Level 1, data lives as files. Spreadsheets are passed around by email. Copies multiply. Every team member may have a slightly different version of the same list.

This is where many organizations start because spreadsheets are flexible and familiar. But flexibility becomes fragility once the data needs to be shared, queried, governed, or connected to AI workflows. There is no durable source of truth, and there is no reliable structure for intelligence to build on.

## Level 2: Structured Data

At Level 2, data moves into centralized systems. Tables, databases, and synchronization rules create order. Teams can agree on a dataset, and sometimes version it.

This is a real improvement. Structured data reduces ambiguity, increases efficiency, and helps teams coordinate. But it's a lot of work operating within the structure: structure often shackles us into a rigid forms, strict rules, and outdated categories. We're trapped by data rather than being empowered by it. We're forced to use software applications, and rarely get to touch the data itself.

## Level 3: Semantic Data

At Level 3, data has meaning. Taxonomies, relationships, entity types, metadata, and context make the dataset understandable beyond raw fields and rows.

This is the level where AI starts to become useful. An AI agent can reason over relationships, retrieve the right context, and act with more precision because the data is not just organized. It is described. Humans and AI can work from the same conceptual model instead of improvising around stale exports and limited software applications.

## Beyond Level 3: Living Data Infrastructure

data.Flowers is built for the next layer: living data infrastructure.

We clean and deduplicate messy data, apply smart taxonomies, structure relationships, and publish the result as interactive ecosystem maps with AI search. The output is not simply a nicer spreadsheet. It is a common operating picture: a living map of companies, people, organizations, metadata, and relationships that can be searched, governed, and continuously improved.

This matters because AI is made from data. If the underlying data is stale, duplicated, poorly governed, or semantically thin, the intelligence built on top of it will inherit those limits. Garbage in, garbage out is still true. The difference now is that bad data can scale into bad automation.

Living data gives intelligence better ground. It keeps knowledge connected to the people and organizations that shape it. It gives teams a common surface for review and governance. It creates the structured reality AI systems need if they are going to assist rather than hallucinate. 

We work with data directly, instead of being disintermediated by software.

## The Transformation Layer

The data.Flowers workflow follows a simple progression:

- Clean and deduplicate messy files into a usable foundation.
- Apply taxonomy so categories, tags, and entity types have meaning.
- Structure relationships so the map reflects how the ecosystem actually works.
- Publish as an ecosystem map that people can explore and maintain.
- Enable AI interaction through search, retrieval, and context-aware querying.

The goal is not to replace human judgment. The goal is to give human judgment and AI systems the same reliable terrain.

<section class="article-cta-band">
  <h2>
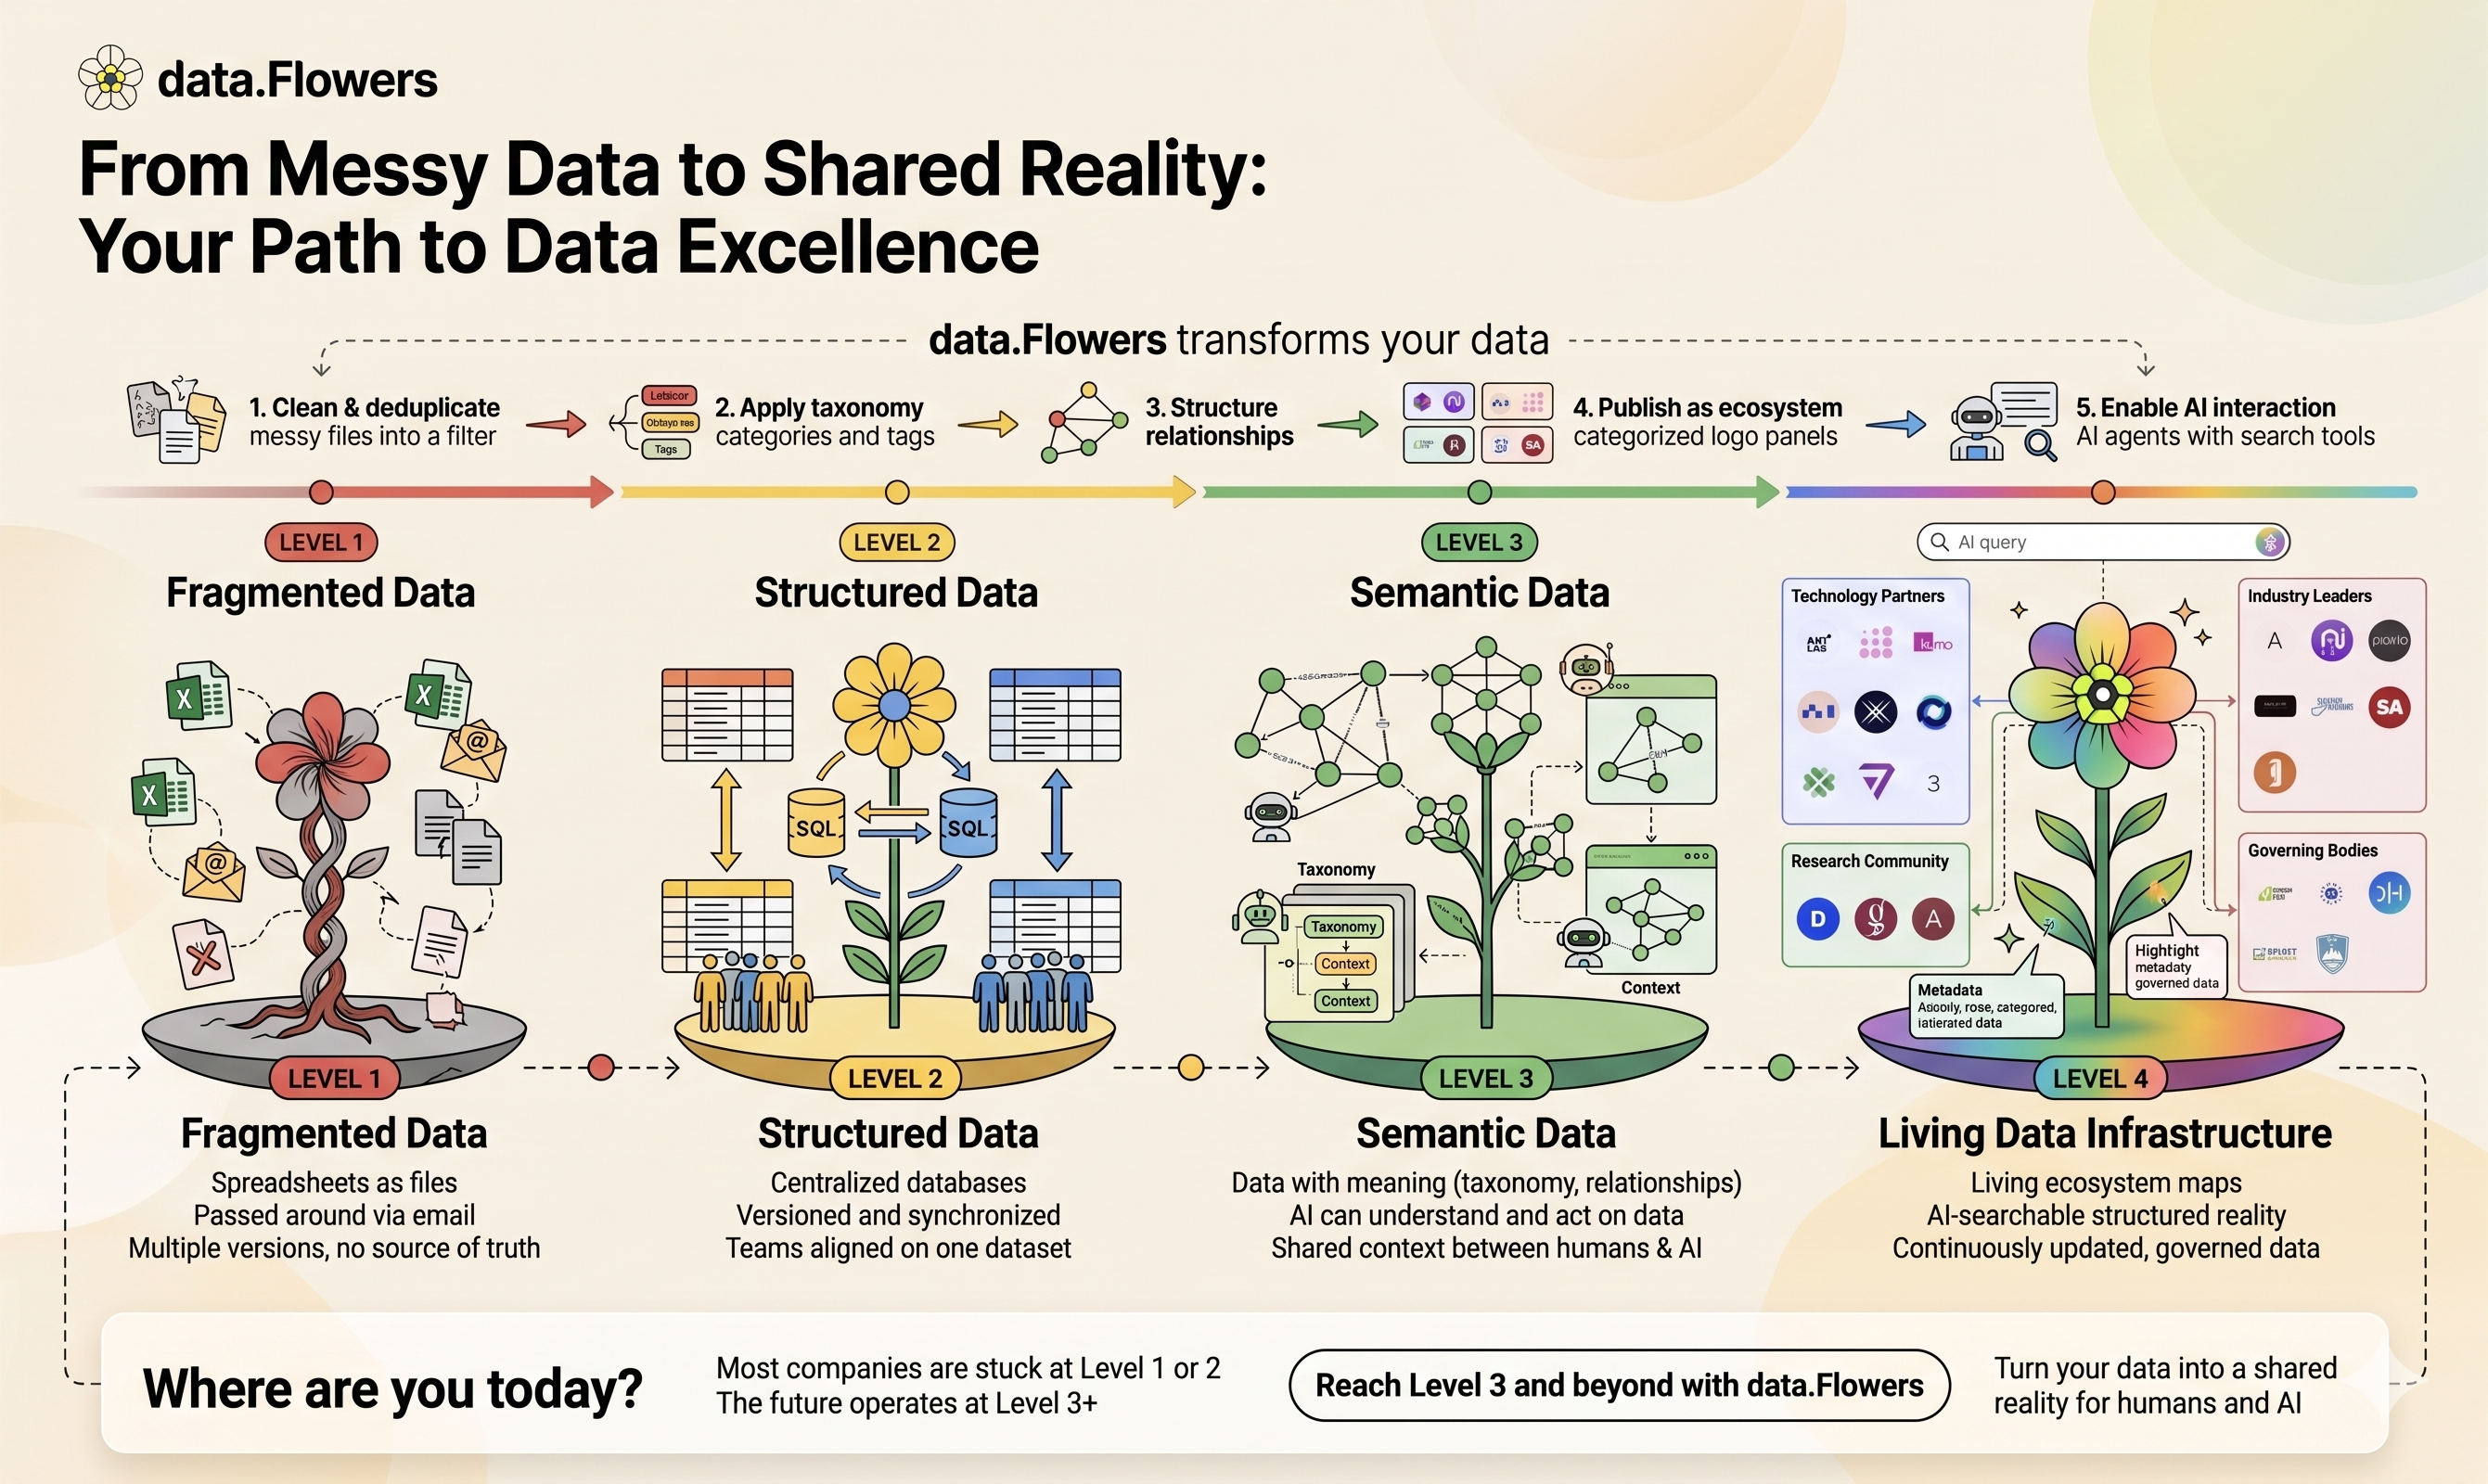
Where are you today?</h2>
  <p>Most organizations are still stuck at Level 1 or 2. The future operates at Level 3 and beyond: semantic, governed, living data that humans and AI can share.</p>
  <a class="btn-primary" href="/#contact-form" data-track="infographic_contact">Reach Level 3 and beyond →</a>
</section>

```


---

## src/investors/index.md

```text
---
layout: layouts/marketing.njk
permalink: /investors/
title: For Investors
description: >-
  data.Flowers protects and nourishes living data so better data can grow into better intelligence.
bodyClass: investor-page
heroCentered: true
eyebrow: For Investors
headline: >-
  Grounded intelligence needs living data.
subtitle: >-
  data.Flowers protects and nourishes living data: knowledge connected to the people, organizations, systems, and places that shape it, govern it, and keep it fresh.
ctas:
  - label: Contact us →
    url: "#contact-form"
    class: btn-light
    track: investor_contact_hero
  - label: hello@data.flowers
    url: mailto:hello@data.flowers
    class: btn-ghost
    track: investor_email
features:
  - label: Intelligence
    title: AI compounds from the data it is fed.
    image:
      src: /assets/investor-illustrations/intelligence.png
      alt: Neural network diagram transforming data inputs into data flower intelligence.
    body: >-
      The market is waking up to a simple constraint: garbage in, garbage out. Model performance, agent reliability, and strategic intelligence depend on data quality that another layer of prompting can't fix.
  - label: Living Data
    title: Most data is fossil data.
    image:
      src: /assets/investor-illustrations/living-data.png
      alt: Fossilized data beside a glowing tree of living connected data.
    body: >-
      Today's datasets are often snapshots of a world that has already changed. data.Flowers turns static records into living systems that stay connected to the people, organizations, and contexts represented inside them.
  - label: Governance
    title: Living data needs caretakers, not surveillance.
    image:
      src: /assets/investor-illustrations/governance.png
      alt: People stewarding shared data around a central living data flower.
    body: >-
      The dominant data model extracts signals from people and organizations without giving them meaningful agency. data.Flowers builds a participatory layer where the subjects of data can shape, govern, and improve the knowledge that describes them.
  - label: Consciousness
    title: The growth of data leads to the growth of intelligence.
    image:
      src: /assets/investor-illustrations/consciousness.png
      alt: Planetary network surrounding Earth with connected data flowers and people.
    body: >-
      As living data grows richer, intelligence becomes more contextual, accountable, and planetary. Our aim is not artificial superintelligence in a box, but planetary consciousness formed from the organizations, people (and all other living things) building it.
ctaHeadline: Want to talk through the investor materials?
ctaBody: Contact us below and we will follow up directly.
ctaPrimary: Send investor note →
ctaPrimaryUrl: "#contact-form"
ctaPrimaryTrack: investor_contact
contactTopicDefault: I’m an investor
---

```


